The Market Overview dashboard in the Traffic & Market toolkit gives you instant competitive intelligence about your marketplace. This dashboard reveals competitor positions, traffic distribution, and market opportunities in a format designed for quick, actionable insights.
Marketing strategists gain immediate visibility into competitive landscapes while business development teams spot market gaps before competitors do.
The dashboard delivers:
- Market position mapping with the Growth Quadrant
- Traffic metrics across all competitors in your space
- Market consolidation analysis showing who’s dominating the space
- Market size and growth metrics (TAM & SAM) for opportunity assessment
- Competitor performance comparisons, including purchase conversion and traffic channels
- Historical trend analysis to identify strategic shifts
These data-driven insights help you make informed decisions about competitive positioning, channel investment, and market expansion.
See exactly where you stand against competitors and discover which market opportunities remain untapped.
Getting started with the Market Overview dashboard
The Get Started menu is your entry point into the Semrush Traffic & Market Toolkit. It’s designed to help you quickly enter domains and move into your analysis of their traffic and marketing performance.
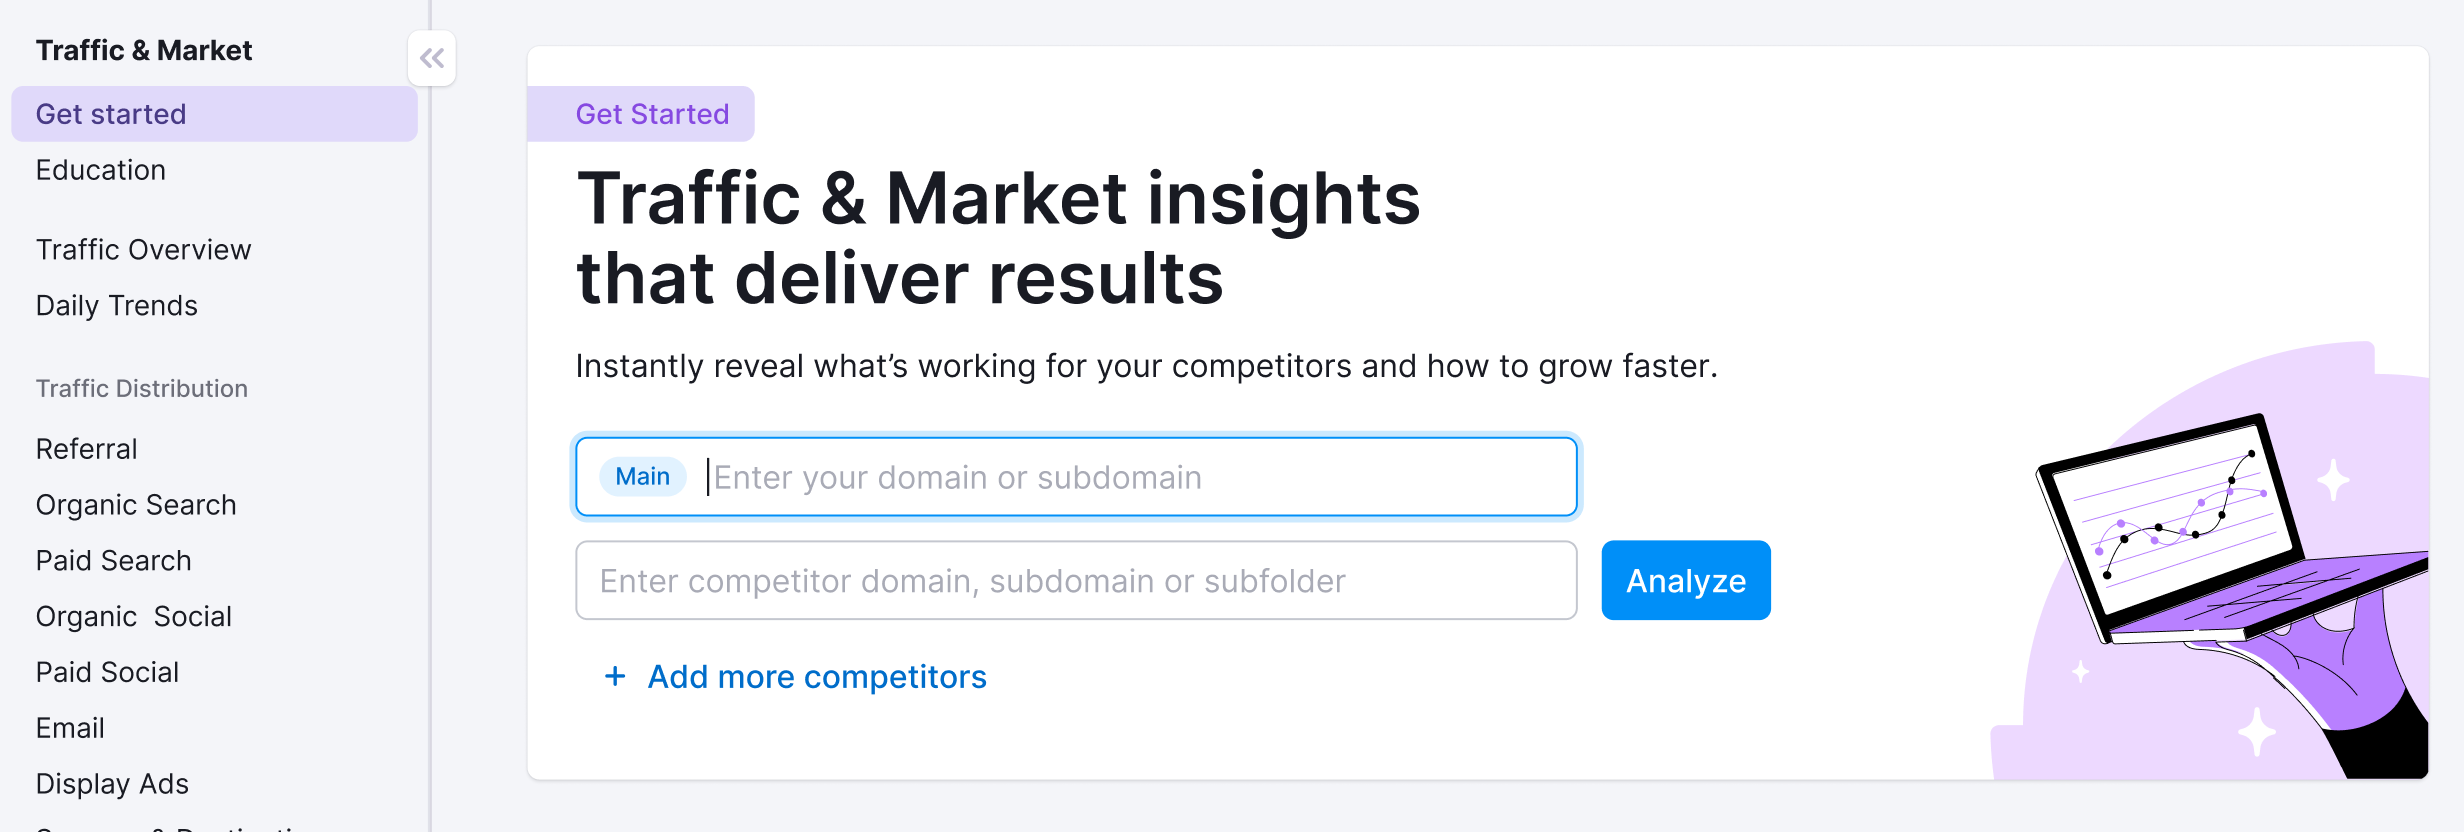
You’ll use this page to kick off your analysis—it’s your launchpad into the entire Traffic & Market experience.
If you haven’t created any projects yet, you’ll see a search panel where you can:
- Type in a domain — Start by entering the main domain you’d like to analyze
- Add additional competitors — Use the “+ Add more competitors” link to compare multiple sites at once
- Click the “Analyze” button — This will pull up dashboards with data and charts, starting with the Traffic Overview dashboard
If you’ve already entered domains into the toolkit, you’ll see them saved as “Folders” and you can access them anytime.
In this case, you’ll see your saved folders listed on the Get Started screen. Click any one of them to jump straight into your dashboards and pick up right where you left off.
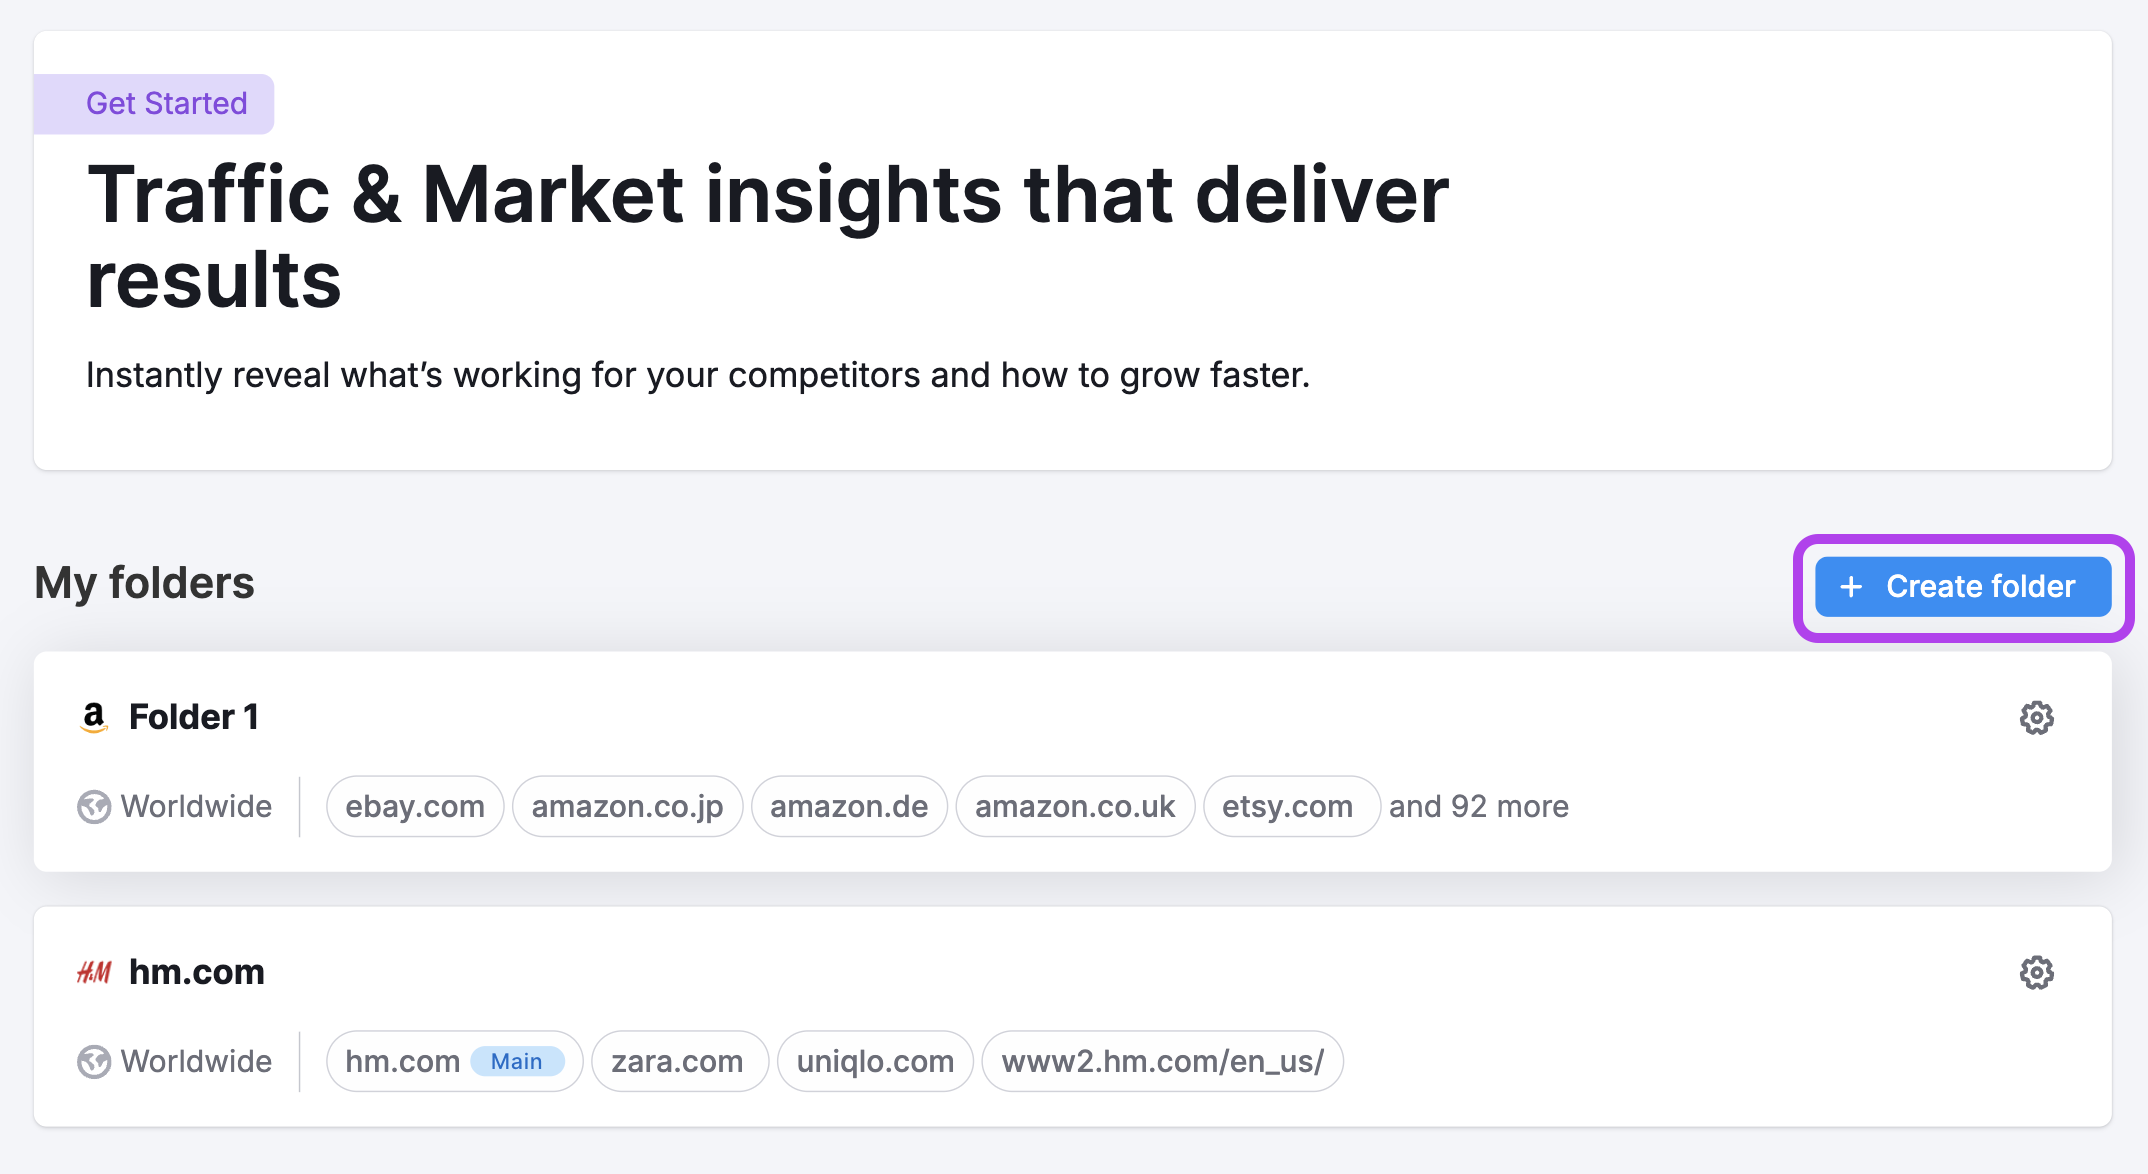
Use the “Create Folder” button to start a new project whenever you're analyzing a new domain or market.
Note: At any time—no matter which dashboard you're on—you can click the Folders dropdown in the upper left corner of the dashboard to select another folder or add more competitors to your analysis without losing your place.

Market Overview Dashboard Key Features
The Market Overview dashboard brings together powerful widgets and visualizations that paint a clear picture of your competitive landscape, market size, and growth trends.
Note: Use the controls at the top of the dashboard to select the market, adjust date ranges, and filter by traffic type, device, or location for deeper analysis.
Market Summary
See a high-level snapshot of your entire market. Key stats include the total number of domains in your market, overall market traffic, and the estimated cost of acquiring that traffic. This summary gives you a quick sense of market scope and investment levels at a glance.
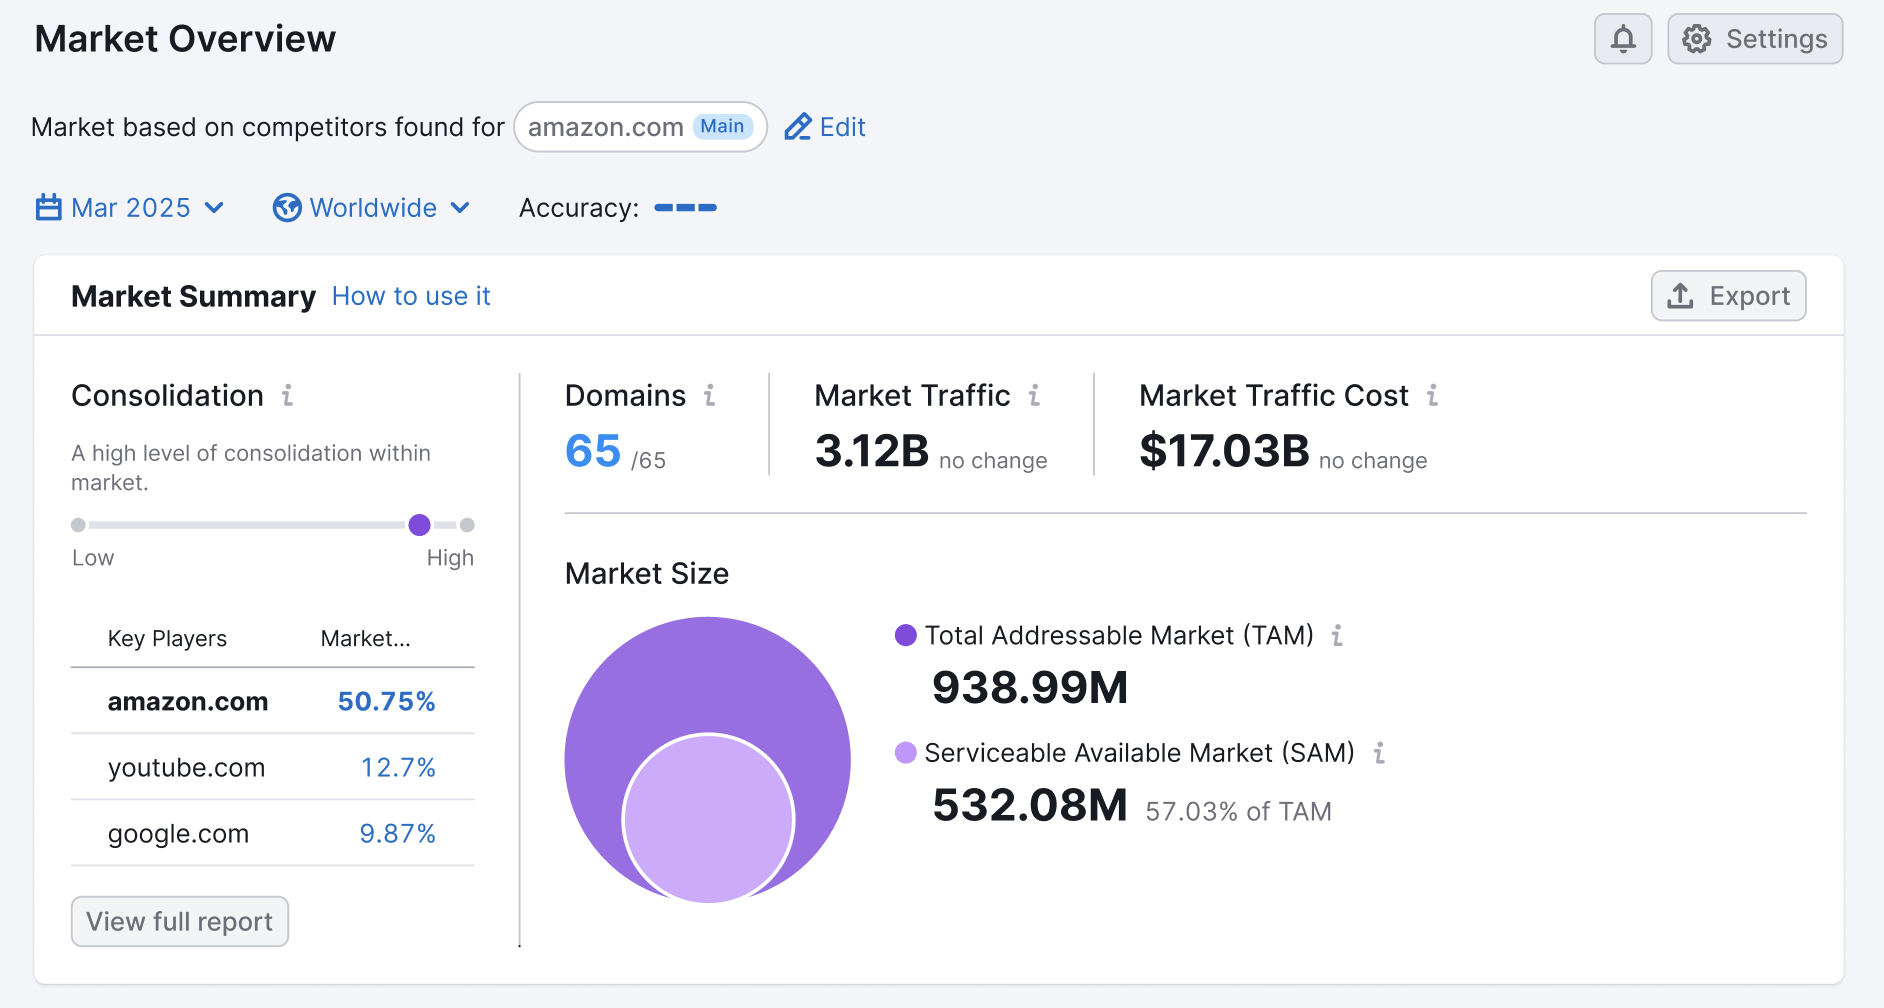
Metrics in this section include:
- Consolidation: The overall concentration of market share among top competitors
- Key Players: The leading domains and their exact market share percentages
- Domains: The total number of domains included in the market analysis
- Market Traffic: The combined number of visits across all domains in the selected market
- Market Traffic Cost: The total value of market traffic in dollar terms
- Market Size (TAM): Indicates the total potential traffic available in the market
Growth Quadrant
The Growth Quadrant plots competitors based on their traffic volume and growth rate, giving you a dynamic view of who’s gaining momentum and who may be losing ground.

Use the Growth Path feature to track how competitor positions shift over time, revealing longer-term trends and emerging threats. Customize your view by using the dropdowns to select different criteria for the X and Y axes and unlock unique insights.
Market Players
Analyze competitors side by side across key traffic channels. Percentage changes and trend indicators help you spot who’s investing in new acquisition strategies, shifting focus, or capitalizing on emerging channels.

How can I act on the insights found in these dashboards?
The Market Overview dashboard is your command center for competitive benchmarking and opportunity discovery.
Here’s how you can put the data to work:
- Benchmark your position: Use Market Summary and Market Consolidation to compare your domain’s market share, traffic, and investment levels with top competitors. Spot gaps and set realistic targets based on where you stand.
- Identify high-potential segments: Market Size visualization lets you see where untapped growth opportunities lie. Use TAM and SAM insights to prioritize expansion into new segments or regions.
- Monitor competitive momentum: The Growth Quadrant quickly shows which competitors are accelerating and which are slowing down. If you notice a rival gaining speed, analyze what channels they’re investing in or which strategies might be fueling their growth.
- Track investment and channel shifts: With Market Players, compare competitors’ channel focus over time. Identify emerging marketing channels, new entrants, or shifting investment patterns—so you can pivot your own strategy accordingly.
By regularly checking the Market Overview dashboard, you’ll stay ahead of shifts in your market—making proactive, data-driven decisions instead of reacting to trends after they’ve happened. Use these insights to refine your marketing mix, defend your position, and confidently target new areas for growth.
Where does Semrush traffic data come from?
Traffic Analytics reports are based on petabytes of clickstream data that comes from multiple proprietary and third-party data sources, Semrush’s proprietary AI and machine learning algorithms, and Big Data technologies. The data is accumulated and approximated from the user behavior of over 200 million real internet users, and over a hundred different apps and browser extensions are used to collect it.
For more information about how Semrush turns traffic data into traffic intelligence, refer to our article here.
As Traffic Analytics data is not obtained from any website’s internal analytics, the numbers you see here might differ from what you see in your Google Analytics or similar trackers you use. However, if you want to analyze only your own website traffic without comparing it with others, we recommend that you refer to your own Google Analytics.
All numbers in Semrush Traffic Analytics are perfectly comparable, meaning you can match two or more websites in the tool and see how their metrics differ from each other in %.
What related Traffic & Market dashboards should I use?
To expand your analysis, pair the Market Overview dashboards with:
- Traffic Overview Dashboard – To get a high-level view of total visits, engagement metrics, and traffic sources across all channels over time
- Daily Trends Dashboard – To monitor short-term shifts in traffic and channel performance on a day-to-day basis
- Audience Overlap – To compare audience intersections between multiple domains and spot shared or unique reach
- Demographics Dashboard – To discover age and gender segments that drive the most traffic to a given domain