The Audience Overlap dashboard is part of the Semrush Traffic & Market Toolkit. It helps you see how much audience traffic different domains share—making it easier to identify overlapping interests, competitive crowding, and new partnership opportunities.
Use this dashboard to uncover which websites are fighting for the same visitors, which audiences are unique, and where you might have room to grow or stand out.
Getting started with the Audience Overlap dashboard
The Get Started menu is your entry point into the Semrush Traffic & Market Toolkit. It’s designed to help you quickly enter domains and move into your analysis of their traffic and marketing performance.

You’ll use this page to kick off your analysis—it’s your launchpad into the entire Traffic & Market experience.
If you haven’t created any projects yet, you’ll see a search panel where you can:
- Type in a domain — Start by entering the main domain you’d like to analyze
- Add additional competitors — Use the “+ Add more competitors” link to compare multiple sites at once
- Click the “Analyze” button — This will pull up dashboards with data and charts, starting with the Traffic Analytics dashboard
If you’ve already entered domains into the toolkit, you’ll see them saved as “Folders” and you can access them anytime.
In this case, you’ll see your saved folders listed on the Get Started screen. Click any one of them to jump straight into your dashboards and pick up right where you left off.

Use the “Create Folder” button to start a new project whenever you're analyzing a new domain or market.
Note: At any time inside any dashboard, you can select the Competitor list drop-down in the upper left to edit your current list or create a different one without losing your place.

How to use the Audience Overlap dashboard
The Audience Overlap dashboard is interactive and customizable. Use the filters at the top of the page to tailor your analysis and explore traffic flows in detail. Start by selecting your date range, location, and device type preferences.
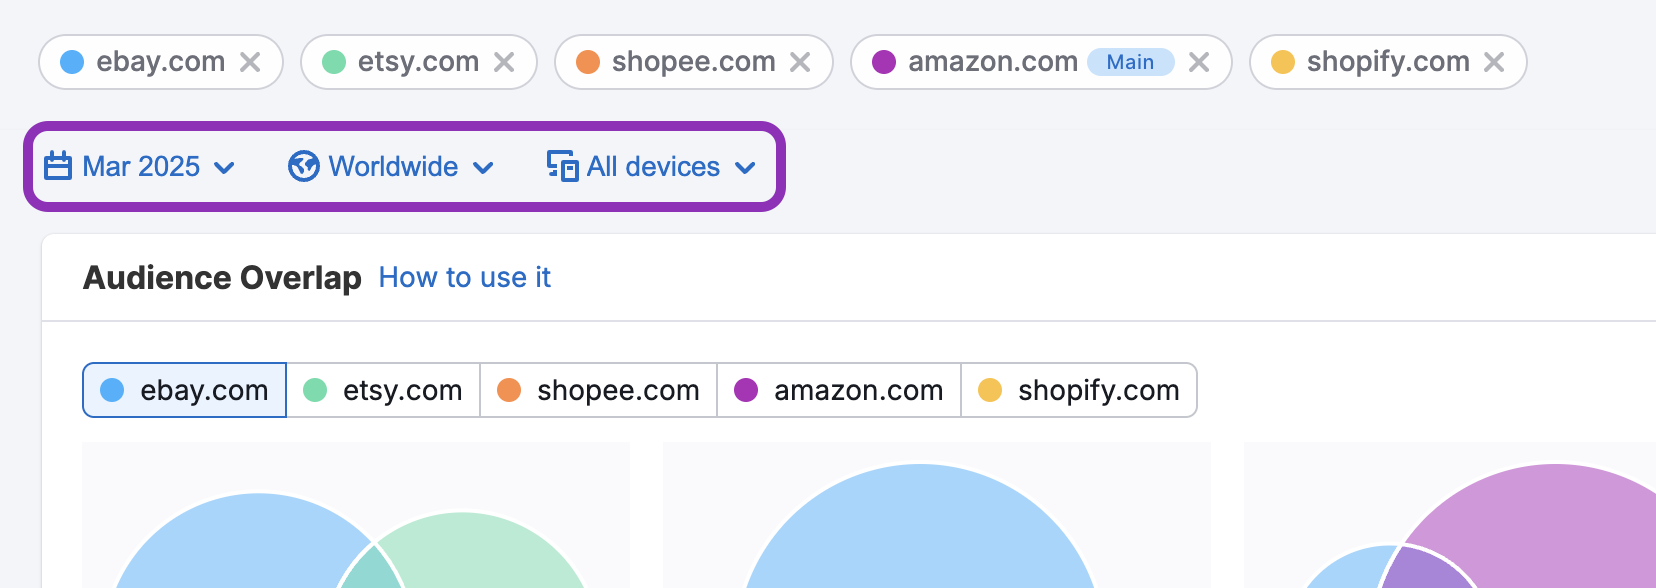
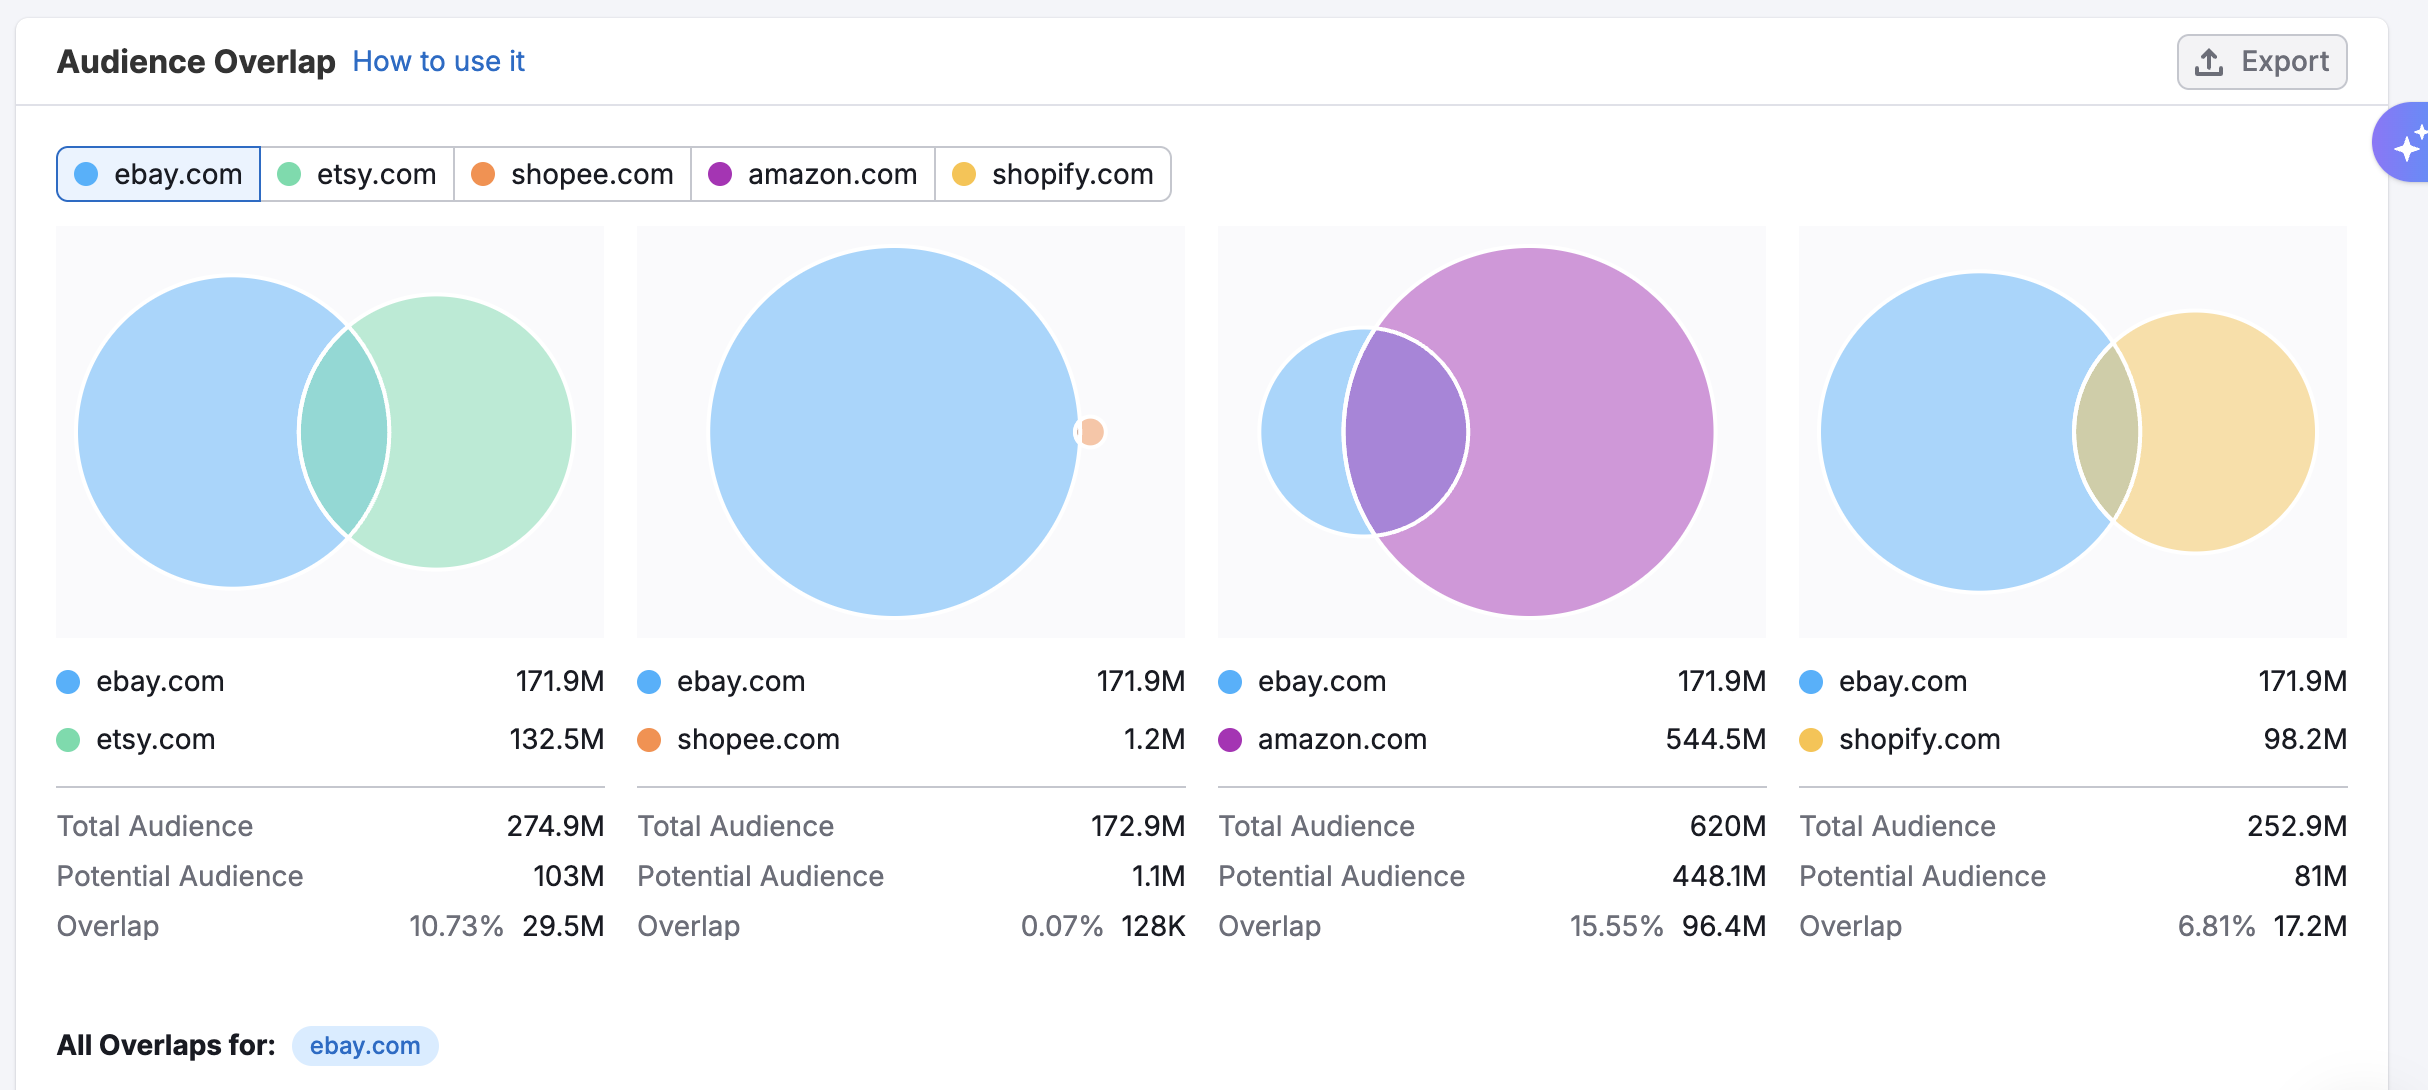
The Audience Overlap section is the first you’ll encounter inside this dashboard. At the top, you can select the primary domain you’d like to focus on. The Venn diagrams below will update to show how much audience overlap that domain has with each of the other selected domains.
Each diagram visualizes audience relationships:
- Circle size represents the Total Audience of each domain—the number of users who visited that domain during the selected time frame
- Overlap size shows the number of users who visited both domains
- Overlap percentage reflects what portion of the combined audience is shared
- Potential Audience refers to users who visited the comparison domain but not the selected primary domain—offering insight into your untapped reach
Hover your cursor over any section of the diagram for the specific data for that portion of the audience.
Use this section to quickly identify where audiences intersect, where you might be losing traffic to competitors, and where unique or underexploited opportunities exist.
Below the Venn diagrams, you’ll find the Overlap Table, which lists all audience combinations across the selected domains. This table gives you a sortable, detailed breakdown of overlap data across multiple pairings or groupings.
The table includes the following columns:
- Total Audience – The combined number of users who visited any of the domains in the overlap group
- Potential Audience – Users who visited at least one of the other domains but not the primary one
- Audience Overlap – The percentage and volume of users who visited both (or all) domains in that group

Use the table to:
- Sort by overlap size or percentage to quickly find the most competitive intersections
- Scan across different combinations of domains to spot patterns in shared audience behavior
- Identify gaps in reach or opportunities to grow unique audience segments through targeting or partnerships
Finally, the Visited Domains section shows the websites most frequently visited by users from the selected domains.

Start by defining your audience scope for the table using the dropdown menu. You can select from three options:
- Total audience of – Displays domains visited by users who have visited the selected domain(s), regardless of whether they visited others
- Total audience overlap – Shows domains visited specifically by users who visited multiple selected domains (shared audience only)
- Total audience excluding – Displays domains visited by users who visited other selected domains but not the one you exclude (revealing what’s unique to non-overlapping audiences

Next, scroll down to the table, which includes the following columns:
- Domain – The external website being visited
- Category – The industry classification of that site
- Total Audience – The total number of users who visited the external domain
- Potential Audience – Users who visited the external domain but not the selected one
- Audience Overlap – The number and percentage of users who visited both the selected and external domains
Use the filter bar to:
- Filter by a specific domain or keyword
- Filter filter by category of domains
- Toggle Safe Mode on or off for brand-safe results

Use this section to understand shared user behavior outside of your selected domain group and uncover content, platforms, or communities your audience already engages with.
The Audience Overlap dashboard gives you a clear view of how audiences intersect across competing domains. With this insight, you can refine your targeting, uncover new growth opportunities, and build smarter partnerships based on actual user behavior.
How can I act on the insights found in the Audience Overlap dashboard?
The Audience Overlap dashboard helps you analyze how different competitors’ audiences intersect, revealing key dynamics in your market. Here’s how to put these insights to work:
- Spot audience competition – Identify which competitors are attracting the same visitors and how much overlap exists between them
- Gauge market crowding – Understand whether audiences are being shared across many players or concentrated around just a few
- Find partnership opportunities – Look for complementary, non-competing domains that share traffic with your key competitors
- Evaluate positioning – Use overlap patterns to infer how different brands are perceived and which ones capture unique versus overlapping attention
- Plan smarter media buying – Prioritize ad placements and content distribution on domains that overlap with high-traffic competitors
By tracking competitor overlap, you can benchmark reach, uncover gaps, and make more informed decisions about where to focus next.
What related Traffic & Market dashboards should I use?
To get deeper insights alongside your Audience Overlap analysis, explore these related dashboards:
- Demographics – Understand the age, gender, location, and visitor trends across your and your competitors’ audiences.
- Traffic Analytics – See high-level traffic performance to support your audience comparison with traffic volume and engagement metrics.
- Top Pages – Find out which content or products attract visitors and help explain overlaps between audiences.
- Sources & Destinations – Analyze where overlapping audiences come from and where they go next.
- Daily Trends – Monitor audience behavior changes at a high frequency to identify fast-moving shifts in shared traffic.
Together, these dashboards help you understand not just who your shared audience is—but what they do, what content they engage with, and how their behavior changes over time.